The Computer Officers are available to help you with computing matters - you can contact them in a variety of ways if you need support.
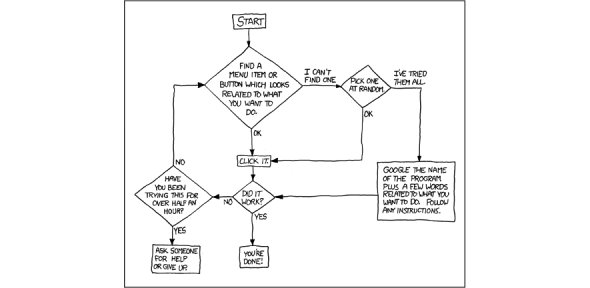
(Image courtesy of https://xkcd.com)
Then you might find our A-Z site index useful. Or, you can search the site using the box at the top of the page, or by clicking here.